• This is default featured slide 1 title

    Go to Blogger edit html and find these sentences.Now replace these sentences with your own descriptions.This theme is Bloggerized by Official Notes - Premiumbloggertemplates.com.

  • This is default featured slide 2 title

    Go to Blogger edit html and find these sentences.Now replace these sentences with your own descriptions.This theme is Bloggerized by Official Notes - Premiumbloggertemplates.com.

  • This is default featured slide 3 title

    Go to Blogger edit html and find these sentences.Now replace these sentences with your own descriptions.This theme is Bloggerized by Official Notes - Premiumbloggertemplates.com.

  • This is default featured slide 4 title

    Go to Blogger edit html and find these sentences.Now replace these sentences with your own descriptions.This theme is Bloggerized by Official Notes - Premiumbloggertemplates.com.

  • This is default featured slide 5 title

    Go to Blogger edit html and find these sentences.Now replace these sentences with your own descriptions.This theme is Bloggerized by Official Notes - Premiumbloggertemplates.com.

Showing posts with label Engineering Basics. Show all posts

Engineering Management: Selection and Evaluation of Projects


Selection of Projects
A typical selection worksheet which includes the factors considered the most is used. The factors to be considered should be relevant to the organization’s environment.

Each project should be graded by more than one qualified person which understands the technical aspects of the project and must have a deep understanding of the organization’s objective and environment.
Scores can be weight in order to provide assistance in the decision of whether to accept or reject a proposal. Scoring and ranking are intended to aid the decision maker, not to make the decision.
The actual selection of project must depend on management’s evaluation of the following questions

  • Does the proposed result meet the long range goals and plans of the organizations?
  • Is the proposed result the type of product, or information, that the organization needs?
  • Does the possible ultimate payoff the justify embarking on the project?

 Note: other considerations are considered as secondary.

After the selection phase, each project should be classified in one of the four category

  • Mandatory. Those projects that are essential for the well being of the organization.
  • Acceptable. These are projects that management is interested in pursuing.
  • Deferred. The projects look interesting and feasible, but are not of immediate interest.
  • Rejected. These projects are of no interest to management now or later.


Evaluation of Projects
For all project, this evaluation consists of

  • Determining the status of the project
  • Deciding whether and how to continue

Status of a new project is based on the data in the proposal and selection work sheet.
It is proposed that management subjectively divide the project into two groups for separate evaluation

  • One group would use the definitions of basic research and applied research.
  • One group would use the definitions of development and technical support.

Basic Assumptions of the system are:

  • A person’s subjective judgment of the relative value between and among projects is more accurate that judgment of an absolute value of any one project.
  • A person’s relative judgment among a few projects is more accurate than evaluation of a large number.


One method of assigning priorities

  1. Ranking. Rank the entire set or projects being evaluated in terms of preference or perceived value of the projected outcomes without assigning quantitative values.
  2. Selecting. Select at a random one project from the set. Let Ps represent the desired outcome of this project.
  3. Subdivide the remaining set of projects by random assignment into groups of no more than five, and preferably into groups of approximately equal size. Each project (other than Ps) should be included in one and only one group.
  4. Add Ps to each group and assign to it a priority value of 1.00 (i.e., priority of Ps=1.00)
  5. For each group, tentatively assign too each project a value that initially seems to reflect the relative value of their proposed outcomes to that of Ps.
  6. Make subjective comparisons of combinations such as Pa vs Pc and Ps. Thus, if the evaluator had the choice of having a successful outcome of Pa or the combination of Pc and Ps, which would be chosen? Suppose the evaluator would rather have Pc and Ps. Then the values of Pa and Pc must be adjusted so that Pa< Pc + Ps. In making adjustments, the value of Ps must not be changed. Continue those comparisons of combinations until the values for each project in the group are consistent for all evaluation.
  7. Compare the rankings obtained for the entire set of projects as obtained by steps 2 to 6 when the groups are recombined with that obtained in step 1. If the rank orders differ, reconsider the ranking from step 1 and, if necessary, proceed again from step 2 to 6 of this procedure.
  8. Once consistent results are obtained, normalize the priorities by dividing the priority assigned to each project by the sum of the priorities assigned to all the projects.
Share:

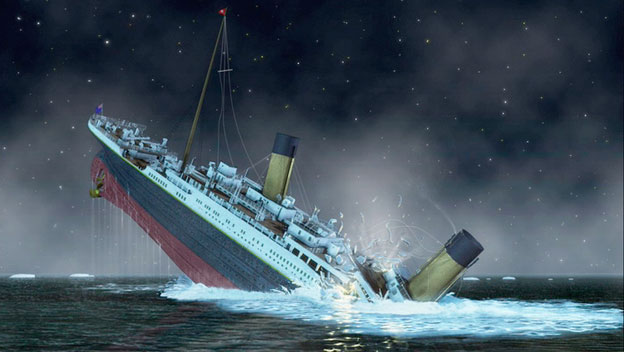
Material Science: Why did Titanic Sunk?

For many years researchers had been looking for an answer why did titanic sunk. For an engineers perspective, this can be because of the following reasons:

1. Climate caused more icebergs
Weather conditions in the North Atlantic were particularly conducive for corralling icebergs at the intersection of the Labrador Current and the Gulf Stream, due to warmer-than-usual waters in the Gulf Stream, Richard Norris of the Scripps Institution of Oceanography told Physics World. "Oceano graphically, the upshot of that was that icebergs, sea ice and growlers were concentrated in the very position where the collision happened," Norris said.

2. Tides sent icebergs southward
Last month, astronomers at Texas State University at San Marcos noted that the sun, the moon and Earth were aligned in such a way that could have led to unusually high tides in January 1912. They speculated that the tides could have dislodged icebergs that were stuck in the Labrador Sea, sending more of them toward the waters traversed by the Titanic a couple of months later.

3. The ship was going too fast
Many Titanicologists have said that the ship's captain, Edward J. Smith, was aiming to better the crossing time of the Olympic, the Titanic's older sibling in the White Star fleet. For some, the fact that the Titanic was sailing full speed ahead despite concerns about icebergs was Smith's biggest misstep. "Simply put, Titanic was traveling way too fast in an area known to contain ice; that's the bottom line," says Mark Nichol, webmaster for the Titanic and Other White Star Ships website.

4. Iceberg warnings went unheeded
The Titanic received multiple warnings about icefields in the North Atlantic over the wireless, but Corfield notes that the last and most specific warning was not passed along by senior radio operator Jack Phillips to Captain Smith, apparently because it didn't carry the prefix "MSG" (Masters' Service Gram). That would have required a personal acknowledgment from the captain. "Phillips interpreted it as non-urgent and returned to sending passenger messages to the receiver on shore at Cape Race,Newfoundland, before it went out of range," Corfield writes.

5. The binoculars were locked up
Corfield also says binoculars that could have been used by lookouts on the night of the collision were locked up aboard the ship -- and the key was held by David Blair, an officer who was bumped from the crew before the ship's departure from Southampton. Some historians have speculated that the fatal iceberg might have been spotted earlier if the binoculars were in use, but others say it wouldn't have made a difference.

6. The steersman took a wrong turn
Did the Titanic's steersman turn the ship toward the iceberg, dooming the ship? That's the claim made in 2010 by Louise Patten, who said the story was passed down from her grandfather, the most senior ship officer to survive the disaster. After the iceberg was spotted, the command was issued to turn "hard a starboard," but as the command was passed down the line, it was misinterpreted as meaning "make the ship turn right" rather than "push the tiller right to make the ship head left," Patten said. She said the error was quickly discovered, but not quickly enough to avert the collision. She also speculated that if the ship had stopped where it was hit, seawater would not have pushed into one interior compartment after another as it did, and the ship might not have sunk as quickly.

7. Reverse thrust reduced the ship's maneuverability
Just before impact, first officer William McMaster Murdoch is said to have telegraphed the engine room to put the ship's engines into reverse. That would cause the left and right propeller to turn backward, but because of the configuration of the stern, the central propeller could only be halted, not reversed. Corfield said "the fact that the steering propeller was not rotating severely diminished the turning ability of the ship. It is one of the many bitter ironies of the Titanic tragedy that the ship might well have avoided the iceberg if Murdoch had not told the engine room to reduce and then reverse thrust."

8. The iron rivets were too weak
Metallurgists Tim Foecke and Jennifer Hooper McCarty looked into the materials used for the building of the Titanic at its Belfast shipyard and found that the steel plates toward the bow and the stern were held together with low-grade iron rivets. Those rivets may have been used because higher-grade rivets were in short supply, or because the better rivets couldn't be inserted in those areas using the shipyard's crane-mounted hydraulic equipment. The metallurgists said those low-grade rivets would have ripped apart more easily during the collision, causing the ship to sink more quickly that it would have if stronger rivets had been used. Other researchers have contested that claim, however.
Share:

Numerical Methods: Problem 1


Given the equation , create a C++ program that finds the value of x by Bisection Method.
#include <iostream.h>

#include <math.h>


double function(double x);

void input(double& a, double& b, double& error);

void bisection(double a, double b, double error, double& root);

void output(double root);


int main()

{


   double a, b, c, d;

   input(a, b, c);

   bisection(a, b, c, d);

   output(d);

   cin.get();

   cin.get();

}

                double function(double x)

{

                double F;

                 F=(16*pow(x,4))-(40*pow(x,3))+(5*pow(x,2))+(20*x)+6;

                return F;

}

                void input(double& a, double& b, double& error)

{

                int n=1;


                                cout<<"============================================================\n";

                                cout<<"Numerical Methods - Finding Roots\n";

                                cout<<"Given F(x)=16(x^4)-(20x^3)+(5x^2)+20x+6\n";

                                cout<<"We are ask to find the root by bisection method\n";

                                cout<<"============================================================\n";

                                cout<<"Enter the value of A: \n";

                                cin>>a;

                                cout<<"Enter the value of B: \n";

                                cin>>b;

                                cout<<"Enter the criteria for convergence: \n";

                                cin>>error;

   while(n==1)

   {

                cout<<"\n\twith L="<<a<<"    "<<"F="<<b;

                cout<<endl;

                cout<<"---------------------------------------------------\n";

                cout<<"\t      F(A)                       F(B)\n";

                cout<<"              "<<function(a)<<"                      "<<function(b)<<endl;

                cout<<"---------------------------------------------------\n";

      double x;

                                x=function(a)*function(b);

      if (x>0)

      {

                cout<<"\n\n\tTry again another value of B: ";

                cin>>b;

                n=1;

      }

       else

                n=0;

   }

}

void bisection(double a, double b, double error, double& root)

{

                double x, i, fxabs, fx, fa, zero=0;

   int n=1, j=1;

   while(n==1)

   {

                x=(a+b)/2;

      cout<<endl;

      cout<<"with x"<<j<<"="<<x;

      cout<<"\n\tF(xmiddle)="<<function(x);

      cout<<endl;

      cout<<endl;

      fx=function(x);

      fa=function(a);

      i=fx*fa;

      fxabs=fabs(fx);

      if ((fx==zero)||(fxabs<=error))

      {

      root=x;

         n=0;

      }

      else if(i>0)

      {

      a=x;

         j=j+1;

         n=1;

      }

      else

      {

                b=x;

         j=j+1;

         n=1;

      }

   }

}

void output(double root)

{

   cout<<"==============================================\n";

                cout<<"The possible root of the given F(x) is "<<root<<endl;

   cout<<"==============================================\n";

}


Share:

Simpliest Notes on Fluid Mechanics 1


Fluids – refers to gases and liquids. It is a collection of molecules randomly arranged and held together by weak cohesive force.

Fluid Mechanics – study which deals with the properties of fluids and the interaction of fluids.
Fluid Groups
  1. Fluid Statics – refers to the fluid that is at rest.
  2. Fluid Dynamics – refers to the fluid that is at motion. 
Density (ρ) – defined as mass divided by volume. The unit is kg/m^3
 
ρ = mass/density
 
Specific Gravity (sp. Gr) – defined as Density of the Material divided by the density of the Water. This has no specific unit. And in experiments, Specific gravity is measured by a hydrometer.

Sp. Gr = density of the substance/density of water
  

Pressure – defined as force divided by Area. The unit is N/m^2 or Pa.
P = force/area
 
  Note:
       The bigger the Area, the smaller the Pressure. The smaller the area, the bigger the pressure.

Fluid Pressure – depend on the depth of the substance.

Gauge Pressure – excess above atmospheric pressure
P - Po = ρgy (Gauge Pressure)

Absolute Pressure – total pressure
P = + ρgy (Absolute Pressure)

Atmospheric Pressure – defined as Po = 1.013x10^5 N/m^2
 
Share:

Engineering Drawing SImple Notes


Engineering Drawing Notes

Projection is defined as the view of an object into a plane called “projection Plane.”

Two Classification of Projection
1.       Parallel Line – plane drawing of an object.
2.       Perspective – multiple view drawing.

Parallel Line Drawing
1.       Orthographic Drawing – drawing of two dimensional object (2D).
2.       Oblique Drawing
3.       Isometric Drawing – drawing with angles on both sides.
4.       Section Drawing – allows to picture out the inside feature of an object.

Equipment Used in Drawing
1.       Pencil – HB and 2H
2.       Eraser
3.       Ruler
4.       Triangular Scale
5.       T Square
6.       French Curve
7.       Erasing Shield
8.       Protractor
9.       Engineering Pen
10.   45 Degrees and 90/60 Degrees Triangles
11.   A3

Lines used in Drawing
Thin Lines
Uses
Dimension (Length)
Hidden Lines
Project inside lines

Phantom Lines
Show movement

Long break line
Short cut of drawing a long line

Dimension / Extension Line
For providing extension lines

Section Lines
To show inside features of a drawing

Center Line
To indicate the center of an object especially circular drawings

Stitch line
Used for stitches representation

Thick Lines
Uses
Dimension (Length)
Visible Lines
To show visibility of a line

Chain line
Representation of a chains

Short break lines
Narrowing the drawing of a line

Cutting / Viewing Plane
For viewing


Perspective Drawing Terms
1.       Station Point – it is the location of the observer of an object to be projected.
2.       Horizontal Plane – it is the plane at an eye level.
3.       Picture Plane – it is the plane perpendicular to horizontal plane.
4.       Horizontal Ground Plane – it is the plane at the lower portion of the horizontal plane.
5.       Horizon Line –the line of intersection of the picture plane and the horizontal plane.
6.       Ground Line – the line of intersection f the picture plane and the ground plane.
7.       Axis of View – it is a line view of a horizontal plane. This is also known as the line of sight.
8.       Center of vision – piercing point of the Axis of vision and the Picture Plane.

3 Principal Views
1.       Top View – horizontal plane
2.       Front View – Vertical
3.       Side View – profile plane

6 Principal Views – expansion of 3 principal views
1.       Top View
2.       Back view
3.       Front View
4.       Left Side View
5.       Right Side View
6.       Bottom View

The Auxiliary View – the view on which is not included in 6 principal views. It is a Slanting Plane.

Uses of Auxiliary View
1.       Find for a true length
2.       Find for a Point View
3.       Find for an Edge View
4.       Find for a True Size
5.       Find for a true angle


Share:

The Importance of Statistic and Probability in Electrical and Computer Engineering


A Research on the Role of
Statistic and Probability in ELECTRICAL and COMPUTER ENGINEERING


                        Electrical and Computer engineers have played a central role in the design of modern information and communications systems. Practical current applications from various areas of electrical and computer engineering are used to show how averages and relative frequencies provide the proper tools for handling the design of systems that involve randomness. These application areas include wireless and digital communications, digital media and signal processing, system reliability, computer networks, and Web systems. This research aims to point out the important role of Statistic and Probability in the field of Electrical Engineering.


General Role of Statistic and Probability

1.      Mathematical models relate important system parameters and variables using mathematical relations. They allow system designers to predict system performance by using equations when experimentation is not feasible or too costly.

2.      Computer simulation models are an alternative means of predicting system performance. They can be used to validate mathematical models.

3.      In deterministic models the conditions under which an experiment is performed determine the exact outcome. The equations in deterministic models predict an exact outcome.

4.      In probability models the conditions under which a random experiment is performed determine the probabilities of the possible outcomes. The solution of the equations in probability models yields the probabilities of outcomes and events as well as various types of averages.

5.      The probabilities and averages for a random experiment can be found experimentally by computing relative frequencies and sample averages in a large number of repetitions of a random experiment.

6.      The performance measures in many systems of practical interest involve relative frequencies and long-term averages. Probability models are used in the design of these systems.


Some of the Specific Application of Statistic and Probability

1.      Computer memories                                                                                                                
    Suppose you are designing a computer memory to hold k-bit words. To increase system reliability, you employ an error-correcting-code system. With this system, instead of storing just the k data bits, you store an additional l bits (which are functions of the data bits). When reading back the (k+l)-bit word, if at least m bits are read out correctly, then all k data bits can be recovered (the value of m depends on the code). To characterize the quality of the computer memory, we compute the probability that at least m bits are correctly read back. You will be able to do this after you study the binomial random variable.


2.      Optical communication systems                                                                              
     Optical communication systems use photodetectors to interface between optical and electronic subsystems. When these systems are at the limits of their operating capabilities, the number of photoelectrons produced by the photodetector is well-modeled by the Poisson random. In deciding whether a transmitted bit is a zero or a one, the receiver counts the number of photoelectrons and compares it to a threshold. System performance is determined by computing the probability that the threshold is exceeded.


3.      Wireless communication systems                                                                    
    In order to enhance weak signals and maximize the range of communication systems, it is necessary to use amplifiers. Unfortunately, amplifiers always generate thermal noise, which is added to the desired signal. As a consequence of the underlying physics, the noise is Gaussian. Hence, the Gaussian density function which plays a prominent role in the analysis and design of communication systems.

4.      Variability in electronic circuits.                                                      
   Although circuit manufacturing processes attempt to ensure that all items have nominal parameter values, there is always some variation among items. How can we estimate the average values in a batch of items without testing all of them? How good is our estimate? You will learn how to do this when you study parameter estimation and confidence intervals. Incidentally, the same concepts apply to the prediction of presidential elections by surveying only a few voters.


5.      Computer network  
traffic.                                                                                                         
    Prior to the 1990s, network analysis and design was carried out using long-established Markovian models. You will study Markov chains. As self-similarity was observed in the traffic of local-area networks, wide-area networks, and in World Wide Web traffic, a great research effort began to examine the impact of self-similarity on network analysis and design. This research has yielded some surprising insights into questions about buffer size vs. bandwidth, multiple time- scale congestion control, connection duration prediction, and other issues.

Share:

Our Sponsor

Popular Post